Features
Macro Editor UI Tour
A complete visual walkthrough of the macro editor - where everything is and what it does.
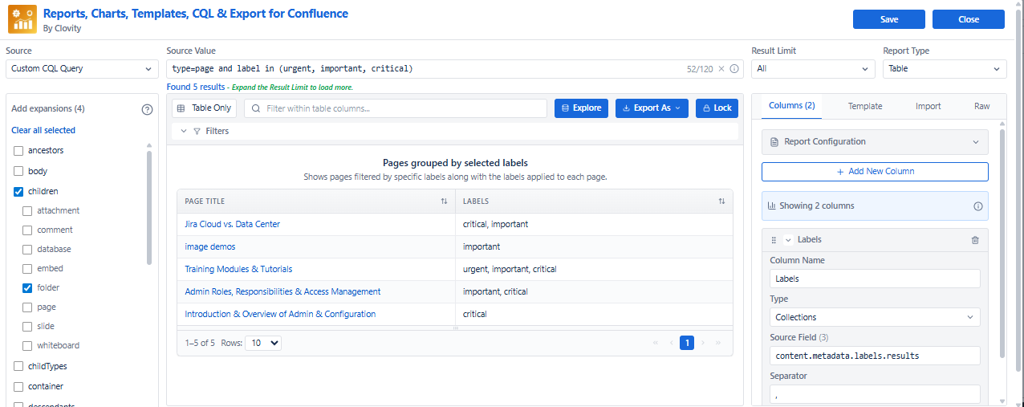
Header Section
The top bar contains the primary controls for your report configuration.


| Header Element | Description | Notes |
|---|---|---|
| Data Source | Toggle between Spaces and Custom CQL | Changes the Source Value field behavior below it |
| Source Value | The actual query or space/page selection | CQL text for CQL mode; visual selector for Spaces mode |
| Result Limit | Max records to return | Default 50. Can be set to any number (e.g. 100, 500) |
| Report Type | Display format selector | Table, List, Paragraph, Grid, Charts |
| Save | Publish the report to Confluence page | Closes editor after saving |
| Close | Exit without saving | Prompts if unsaved changes exist |
Left Panel - Data Expansions
Load metadata fields required for columns, filters, and charts.
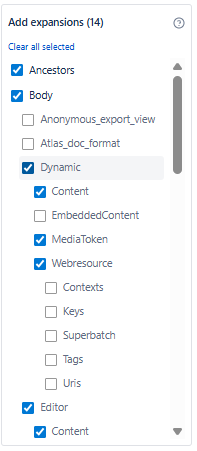
- Search box - real-time filtering of expansion fields by name
- Checkbox selection - check any group to load its fields
- Favorites / Pinned - click the star icon to pin frequently used fields to the top
- Hierarchical groups - organized by Structure, Body & Metadata, History
| Expansion Category | Key Fields |
|---|---|
| Structure | ancestors, children, descendants, container |
| Body & Metadata | body, metadata, operations, restrictions, version |
| History | contributors, lastUpdated, previousVersion, nextVersion, ownedBy |
Center Panel - Live Preview & Tools
The center panel is your main workspace - it shows results and provides all preview and debug tools.
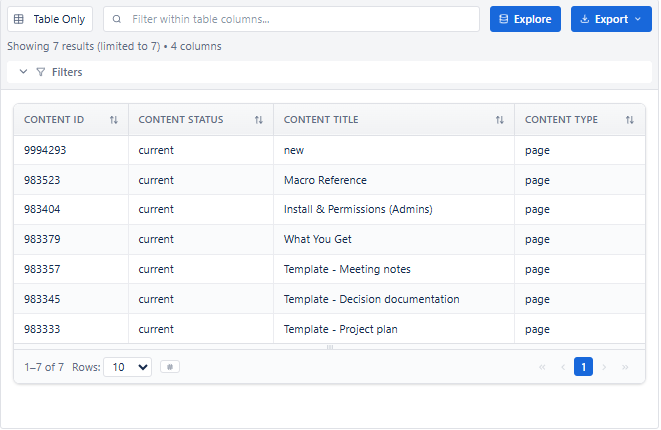
| Element | What It Does |
|---|---|
| Live Preview | Displays report results in real-time. Updates automatically as configuration changes. |
| Filter Panel | Apply filter rows (Operator + Property + Value). AND logic, top-to-bottom execution. |
| Explore | Switch to Explore mode - lists all available fields with types and sample values. |
| Export | Download data as CSV (Table view) or JSON (all views). Includes copy-to-clipboard. |
| Edit (Lock/Unlock) | Templates are locked after applying. Click Edit to unlock and modify. |
| Pagination | Previous/Next buttons, page numbers, results-per-page selector. |
Right Panel - Configuration Tabs
Four tabs for configuring your report structure, applying templates, importing recipes, and inspecting raw data.
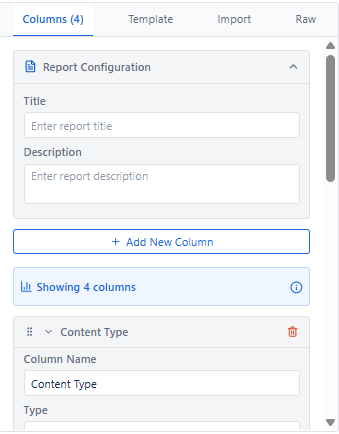
| Tab | Purpose | Key Actions |
|---|---|---|
| Columns | Define what data appears and how it is formatted | Add, Edit, Delete, Reorder, Duplicate, Hide columns |
| Templates | Browse and apply 35 tabular + 17 chart templates | Search, select, apply - auto-configures everything |
| Import | Import JSON recipes to recreate report configurations | Paste JSON, validate, search, copy config |
| Raw | Inspect raw JSON returned from Confluence | View, search, expand/collapse, copy field paths |
Saved Report on Confluence Page
After clicking Save, the macro editor closes and your live report appears directly on the Confluence page.
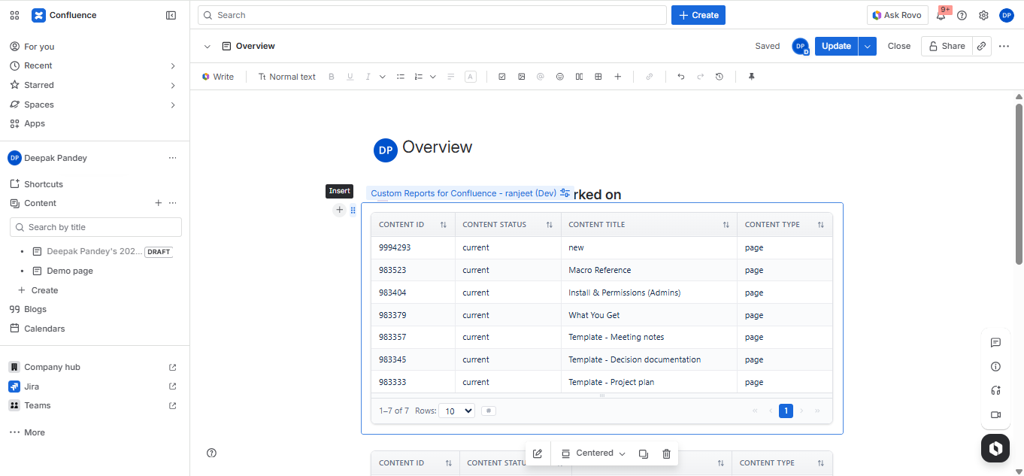
| Element | Where It Appears | What It Does |
|---|---|---|
| Report Title / Header | Top of the macro | Shows the report name or description (if configured) |
| Table with Columns & Rows | Main body | Displays live Confluence data - updates automatically as content changes |
| Search Box | Top of report | Filters visible rows by keyword - does not change the data source |
| Export Button (CSV/JSON) | Top toolbar | Downloads current report data - CSV for spreadsheets, JSON for integrations |
| Pagination Controls (Prev/Next) | Bottom of report | Navigate between pages of results - shows current page and total count |
| Edit Button (pencil icon) | Top right of macro | Reopens the macro editor - only visible to users with edit permission on the page |
Complete Workflow Summary
- Set Data Source (Header) - choose Spaces or Custom CQL and enter source value
- Load Expansions (Left Panel) - select metadata groups needed for your columns
- Check Live Preview (Center) - confirm data is returning correctly
- Use Explore (Center) - discover available field paths and types
- Configure Columns (Right → Columns) - define what to display and how
- Apply Filters (Center) - refine which records appear
- Set Report Type + Result Limit (Header) - choose format and data size
- Inspect Raw View if needed (Right → Raw) - verify JSON paths
- Click Save (Header) - publish the live report to your Confluence page