Custom Charts Gadget
Group By Segments 2D
Add a second dimension to your charts with the "Group By" feature, available for Grouped Bar, Stacked Bar, 2D Line, and 2D Table charts.
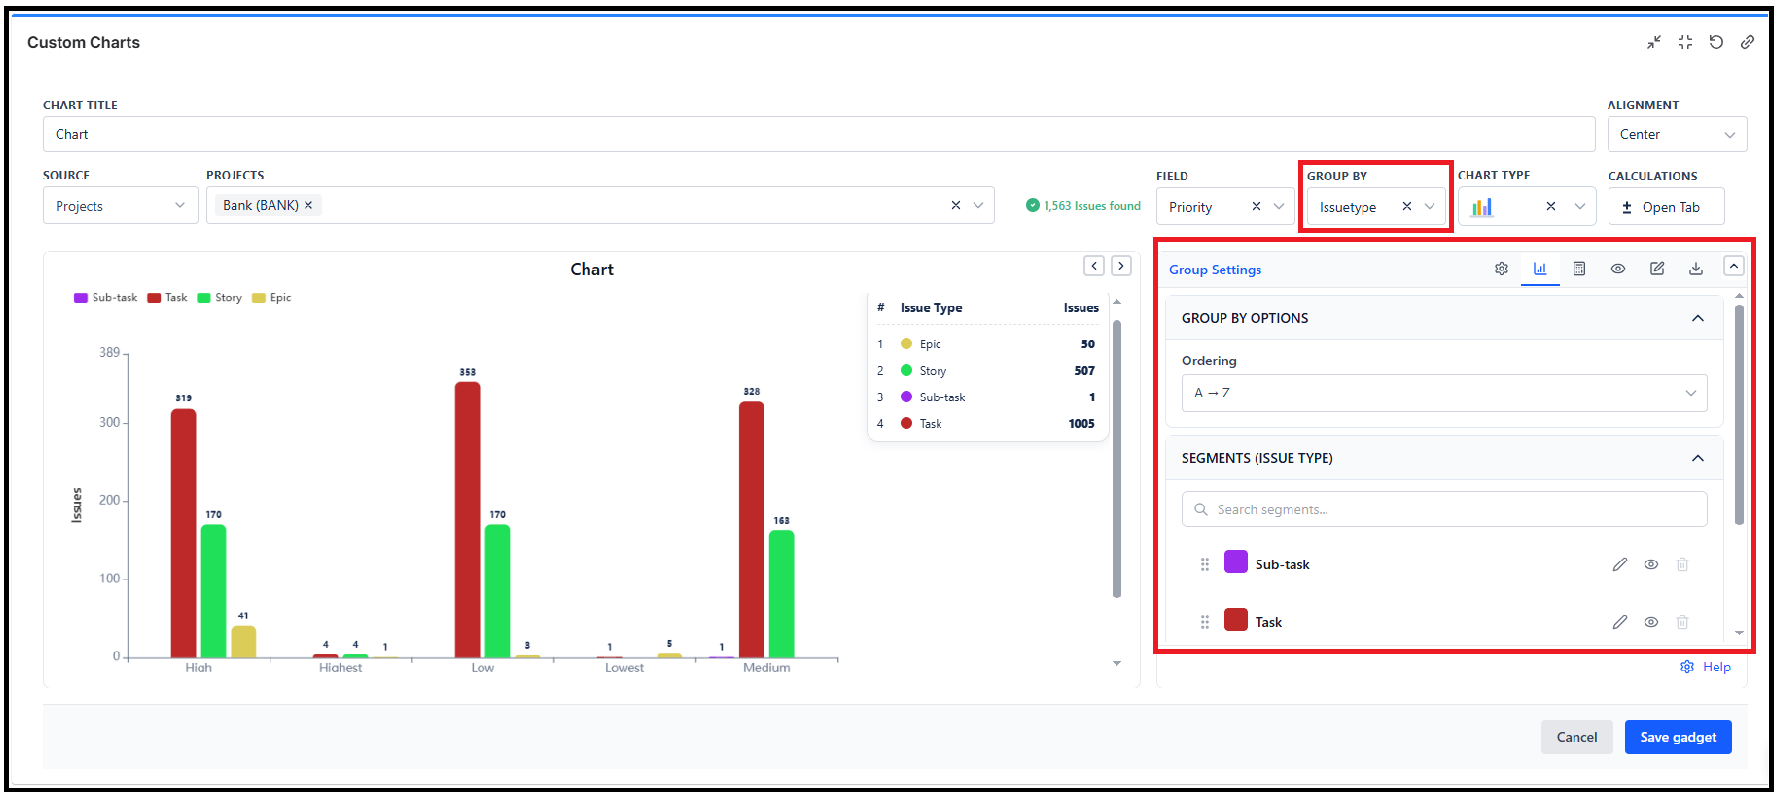
What is "Group By"?
"Group By" adds a second grouping dimension to your chart, creating a two-dimensional visualization.
| Without Group By | With Group By |
|---|---|
| Status (3 bars) | Status x Issue Type (3 groups of 3 bars) |
| One data series | Multiple data series |
| Simple comparison | Cross-dimensional analysis |
Which Charts Support Group By?
| Chart Type | Group By Support |
|---|---|
| Pie | No |
| Bar (1D) | No |
| Grouped Bar | Yes |
| Stacked Bar | Yes |
| Line (1D) | No |
| 2D Line | Yes |
| Table (1D) | No |
| 2D Table | Yes |
| Funnel | No |
| Tile | No |
How Field By and Group By Work Together
Field By = Rows/Categories (X-axis)
Group By = Columns/Series (multiple bars/lines)
Grouped Bar Example
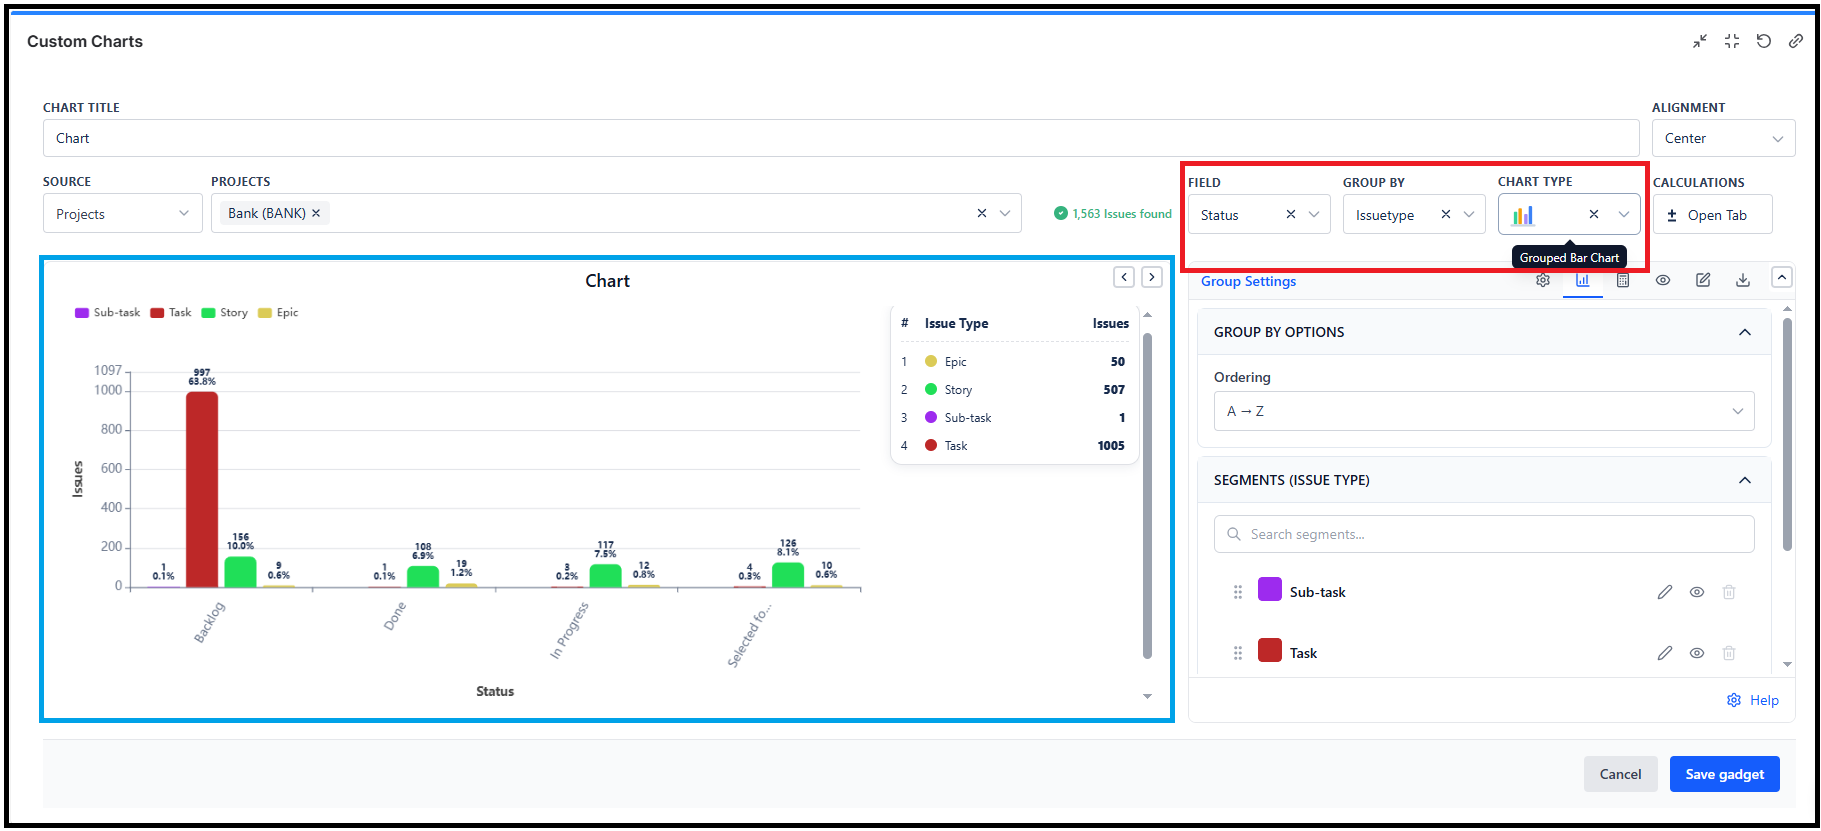
| Setting | Value |
|---|---|
| Field By | Status |
| Group By | Issue Type |
| Result | For each status, see separate bars for Stories, Bugs, Tasks side by side |
Stacked Bar Example
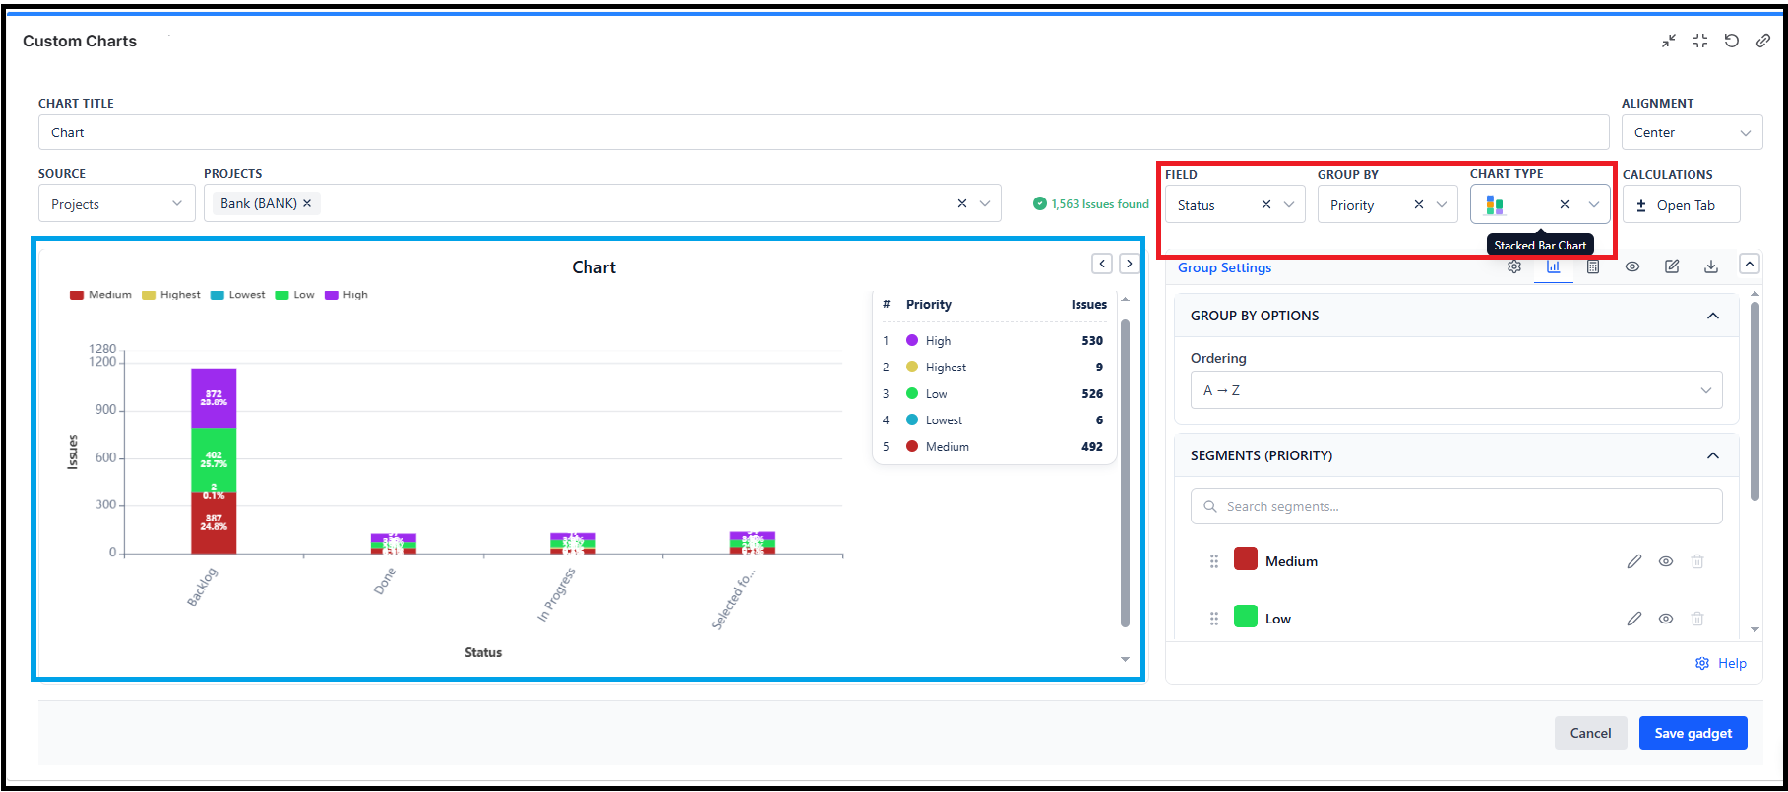
| Setting | Value |
|---|---|
| Field By | Status |
| Group By | Priority |
| Result | Each Status shows priorities stacked in a single bar |
2D Table Example
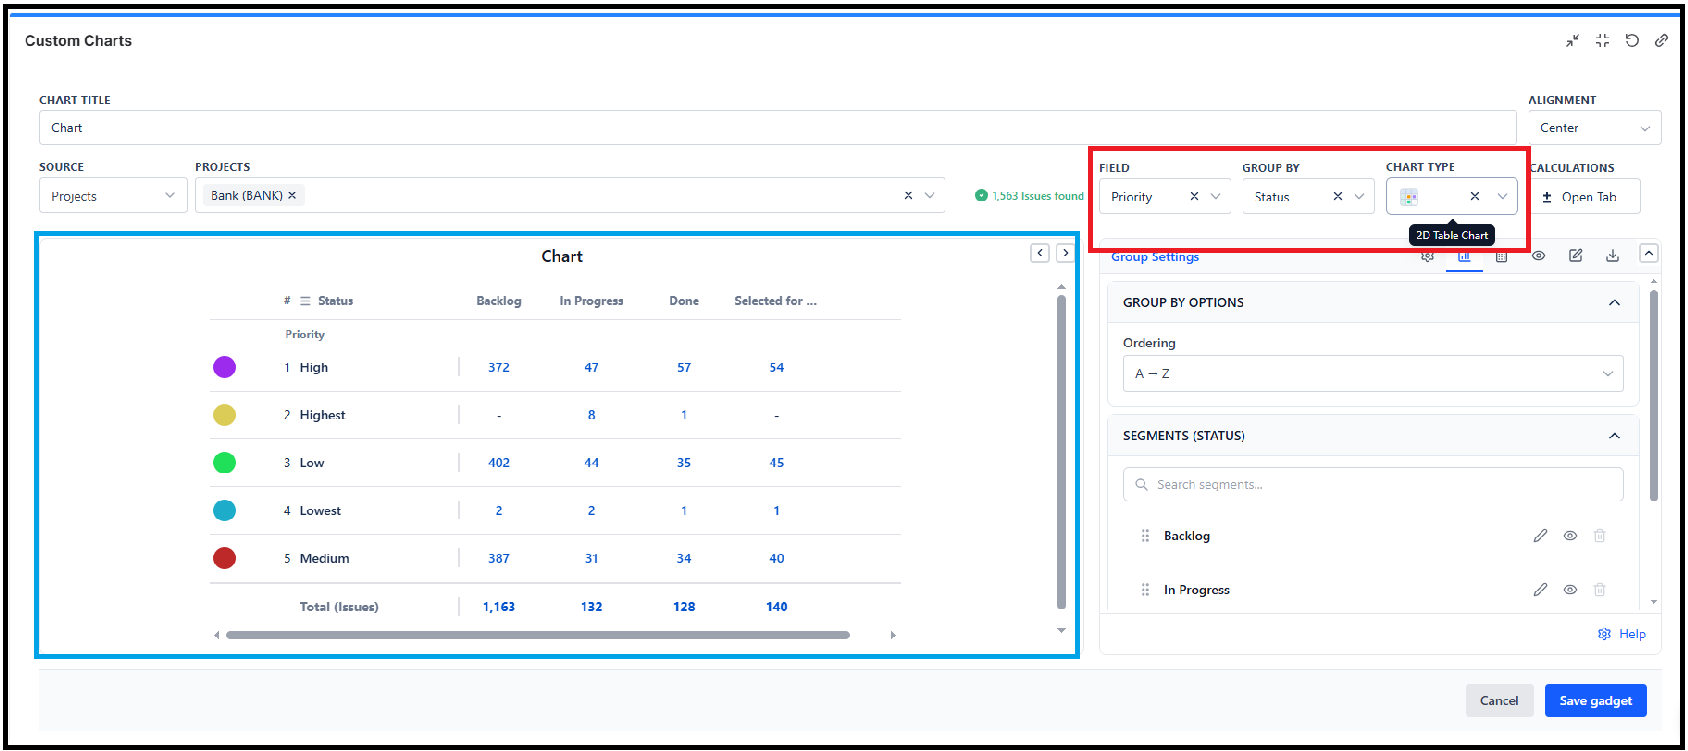
| Setting | Value |
|---|---|
| Field By | Priority |
| Group By | Status |
| Result | Matrix with Priority as rows, statuses as columns |
Common Group By Combinations
| Purpose | Field By | Group By |
|---|---|---|
| Bug vs Story by status | Status | Issue Type |
| Priority mix per sprint | Sprint | Priority |
| Team trends over time | Week | Team |
| Completion by component | Component | Status |
| Work type by person | Assignee | Issue Type |
Best Practices
Limit Group By Categories
- 3-5 categories is ideal for easy reading
- Maximum 7-8 before charts become confusing
Choose Complementary Dimensions
- Status x Type - Different aspects of same issues
- Time x Category - Trend analysis with breakdown
- Person x Status - Individual progress tracking