Custom Tabular Report
Tabular Overview
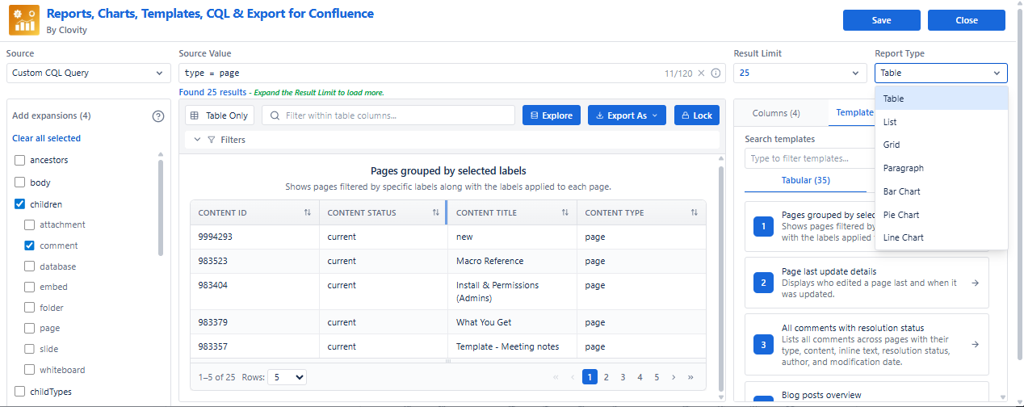
Custom Tabular Report lets you display Confluence data in four flexible layouts - Table, List, Grid, and Paragraph. Each view is suited to a different audience and purpose, all powered by the same underlying data source and column configuration.
Available Views
| View | Layout Style | Best For | Supports Pagination |
|---|---|---|---|
| Table | Rows and columns - spreadsheet-style | Audits, governance, structured data comparison | Yes |
| List | One card per record - vertical list | Page indexes, team directories, readable inventories | Yes |
| Grid | Card tiles in a responsive grid | Visual dashboards, profile directories, galleries | Yes |
| Paragraph | Flowing prose - one block per record | Weekly digests, executive summaries, narrative reports | No |
What All Views Share
- Same data source - Spaces drill-down or Custom CQL
- Same expansions - load once, all views use the same metadata
- Same column configuration - Columns tab applies across Table, List, Grid, and Paragraph
- Same filters - filter rows apply to all tabular views
- Live Preview - switch between views instantly in the macro editor
- Result Limit + Pagination - control dataset size in all views
How to Choose the Right View
| If you want to... | Use This View |
|---|---|
| Compare multiple fields side by side across many records | Table |
| Show a clean, readable list where each item stands alone | List |
| Present visual cards with images - like a team directory or gallery | Grid |
| Create a narrative summary - readable prose, not a data table | Paragraph |
Switching Between Views
- Open the macro editor.
- Change the Report Type dropdown in the header.
- Live Preview updates instantly - no data reload needed.
- Save when satisfied with the selected view.
Note: Charts (Bar, Pie, Line) are configured separately in the Custom Charts Report section and use a different axis/series configuration.