Quick Start Guide
Build your first report in under 5 minutes. Follow these four steps.
Step 1 - Open the Macro Editor
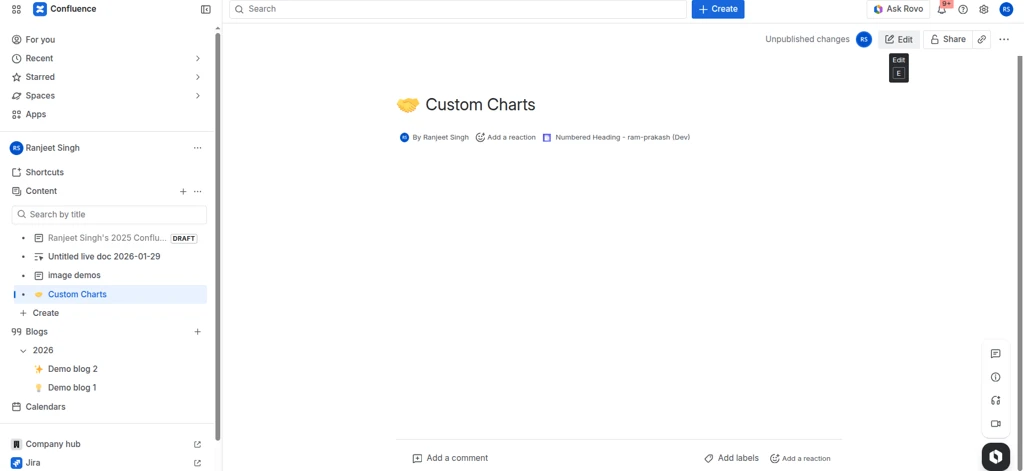
- Open any Confluence page and click the Edit button.
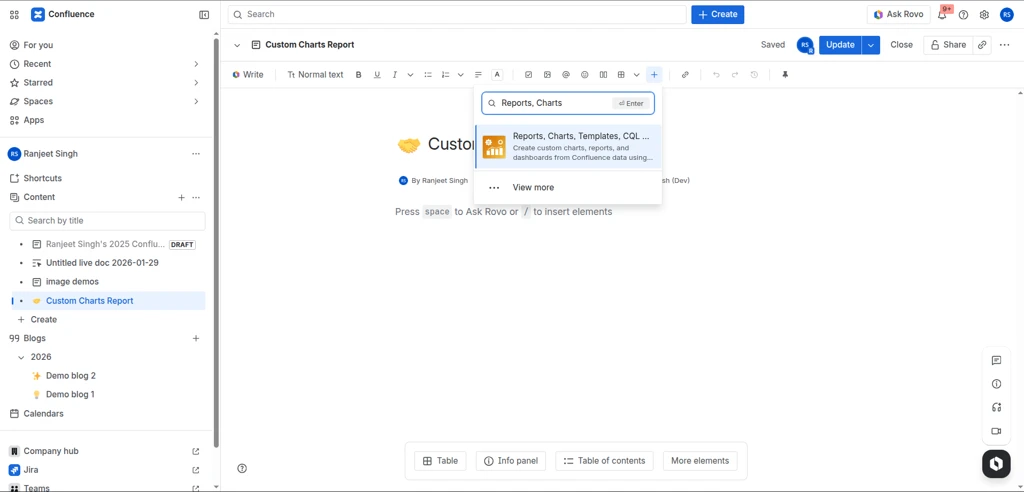
- Type
/to open the macro insert menu. - Search for Reports, Charts, Templates, CQL & Export for Confluence and click to insert.
- The macro editor opens automatically.
Step 2 - Configure the Report
Choose Your Data Source
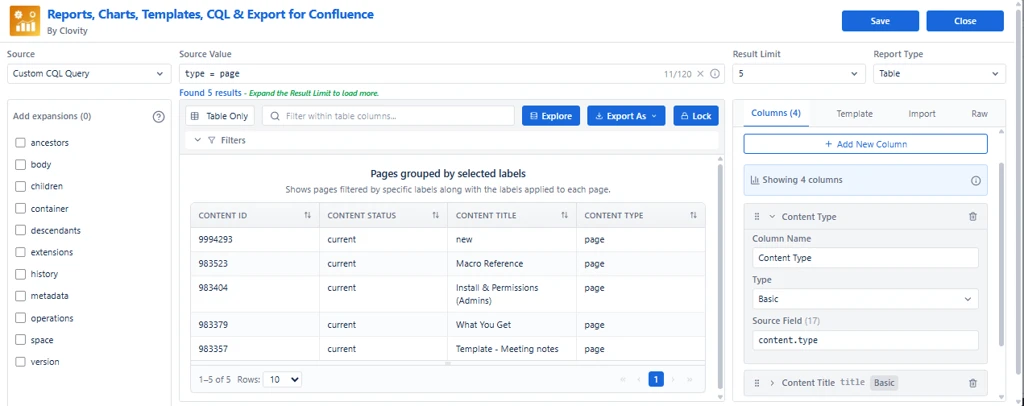
Select Spaces (recommended for beginners) or Custom CQL from the Source dropdown in the header. Specify your source value - select spaces or enter a CQL query.


Select a View
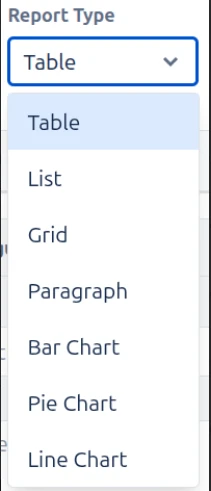
Choose Table from the Report Type dropdown. Table view is easiest to understand for first-time users. Other options: List, Paragraph, Grid, Charts.
Add Expansions
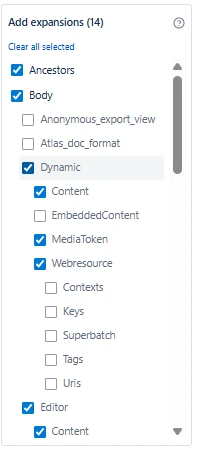
In the left panel, select metadata groups. Load only the metadata you need. Common starting point: metadata and version - these cover most common fields.
Define Columns
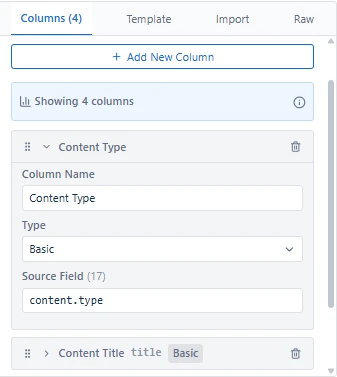
Navigate to the Columns tab in the right panel. Click + Add New Column, set a label, and pick a data field. Apply formatting as needed.
Apply Filters
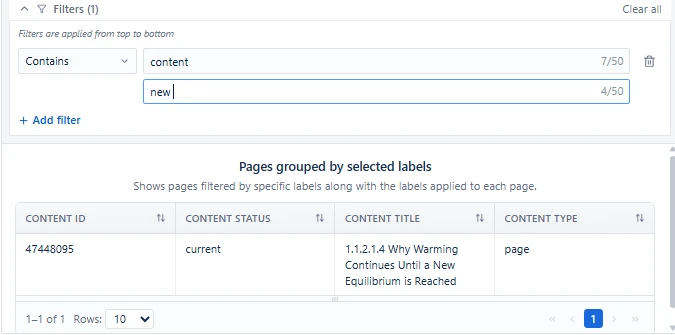
In the center panel, use the Filter section to narrow results. Each filter row narrows results further (AND logic). Click + Add filter to add a row. Use Delete (trash) to remove, or Clear all to reset.
Set Result Limit
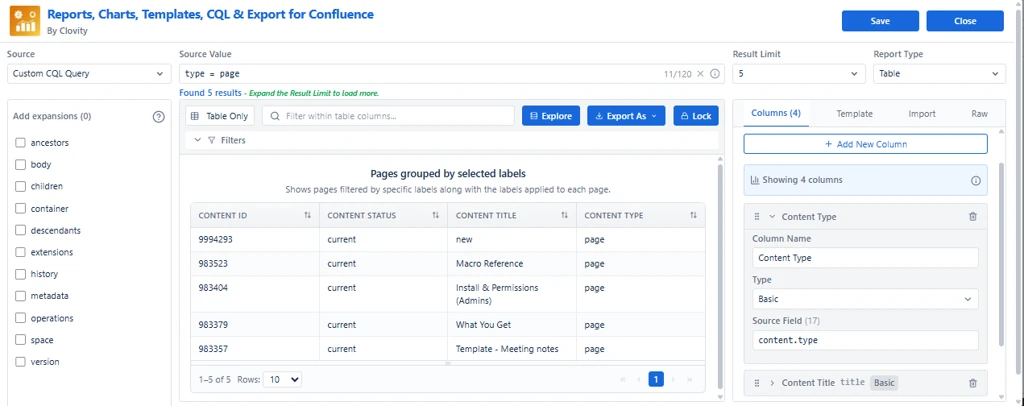
Set an appropriate limit in the header or right panel (e.g., 50, 100, 500). Start with 50 for faster testing.
Step 3 - Confirm Results in Live Preview
The center panel shows your report results in real-time. Verify data looks correct before saving. Adjust configuration if needed.
Step 4 - Save
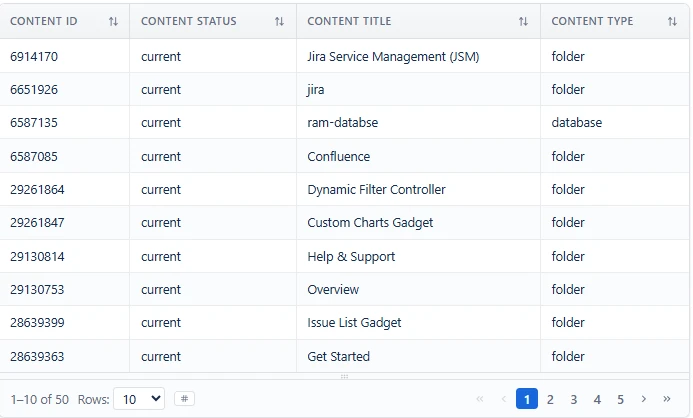
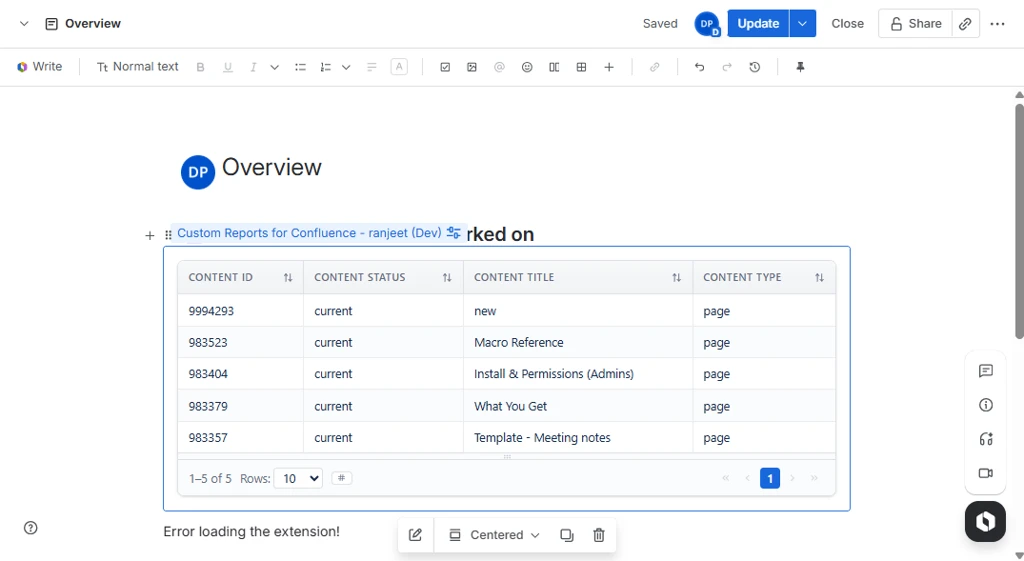
Click Save to publish the report to your Confluence page. The macro editor closes and your live report appears on the page.
Quick Start Tips
- Start with a pre-built template for faster setup - navigate to the Templates tab first
- Use Table view for your first report - it is the easiest to understand
- Load minimal expansions initially, add more as needed
- Check Live Preview frequently to validate changes
What's Next?
| Topic | Where to Go |
|---|---|
| Data source options | Data Source |
| Understanding expansions | Expansions |
| All view types | Report Views |
| Columns and filters | Columns & Filters |
| Pre-built templates | Templates & Import/Export |