Getting Started
Quick Start Guide
Get up and running with your first Jira dashboard chart in under 5 minutes.
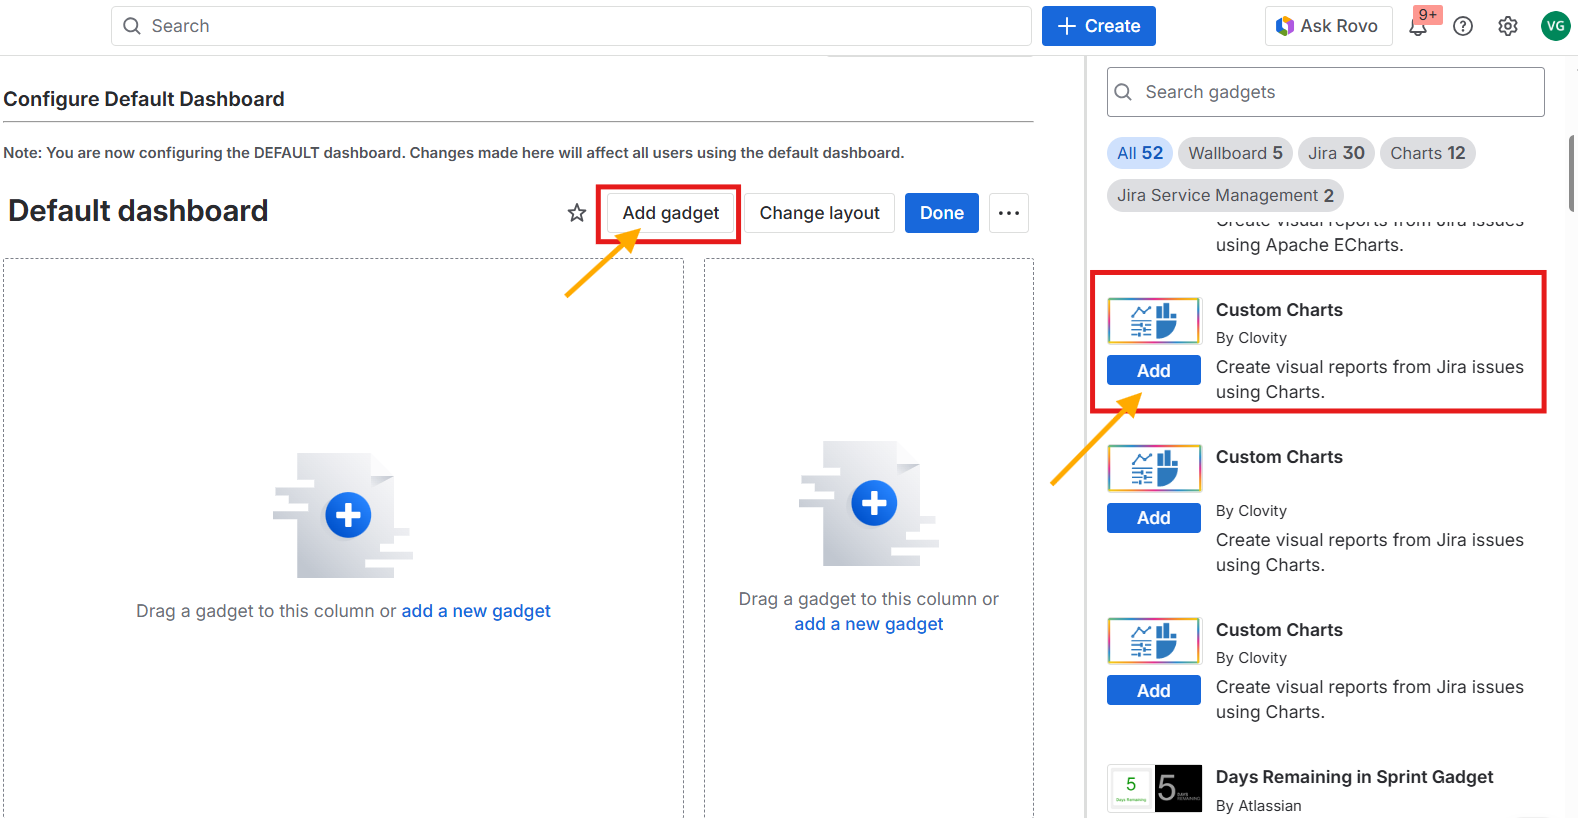
Step 1 - Open or Create a Dashboard
- In Jira, click Dashboards in the top navigation bar
- Select an existing dashboard, or click Create dashboard to make a new one
- Click the Edit button (pencil icon) to enter edit mode
Step 2 - Add Your First Chart
- Click Add gadget (top-right area of the dashboard)
- In the gadget gallery search, type "Custom Charts"
- Click Add - the gadget appears on your dashboard in configuration mode
Step 3 - Set a Data Source
In the left panel of the configuration screen:
- Select Projects as the source type
- Search for and select a Jira project you have access to
- The issue count updates to show how many issues are included
Step 4 - Choose a Chart Type
- Click the Chart Type tab in the right panel
- Select Pie Chart (a great starting point)
- In the Chart By tab, select Status from the field dropdown
- Watch the Live Preview in the center panel update instantly
Step 5 - Save the Gadget
- Click Save gadget at the bottom of the configuration screen
- Your pie chart showing issue status distribution is now live on the dashboard
Step 6 - Add an Issue List (Optional)
- Click Add gadget again
- Search for "Issue List"
- Set the same project as the data source
- Add columns: Key, Summary, Status, Assignee, Priority
- Click Save gadget
Step 7 - Add a Dynamic Filter Controller (Optional)
To make your dashboard interactive:
- Add the Dynamic Filter Controller gadget
- Set the same project as the base data source
- Add filter fields: Status, Assignee, Sprint
- Note the Reference ID shown after saving
- Edit your chart gadget → change Data Source to Dynamic Filter Controller → select the controller
- Now the filter bar controls your chart in real time
What's Next?
- Explore the Chart Types Guide for all 10 chart types
- Try Templates to start from a ready-made chart configuration
- Learn about Smart Labels for visual indicators in Issue List
- Set up Tabs in the Dynamic Filter Controller for preset views